Data 8 datascience Reference
This notebook serves as an interactive, Data 8-friendly reference for the datascience library.
Table Functions and Methods
Table()
Create an empty table, usually to extend with data
[29]:
new_table = Table()
new_table
[29]:
[30]:
type(new_table)
[30]:
datascience.tables.Table
Table.read_table()
Table.read_table(filename)
Creates a table by reading the CSV file named filename (a string).
[3]:
trips = Table.read_table('https://raw.githubusercontent.com/data-8/textbook/refs/heads/main/assets/data/trip.csv')
trips
[3]:
| Trip ID | Duration | Start Date | Start Station | Start Terminal | End Date | End Station | End Terminal | Bike # | Subscriber Type | Zip Code |
|---|---|---|---|---|---|---|---|---|---|---|
| 913460 | 765 | 8/31/2015 23:26 | Harry Bridges Plaza (Ferry Building) | 50 | 8/31/2015 23:39 | San Francisco Caltrain (Townsend at 4th) | 70 | 288 | Subscriber | 2139 |
| 913459 | 1036 | 8/31/2015 23:11 | San Antonio Shopping Center | 31 | 8/31/2015 23:28 | Mountain View City Hall | 27 | 35 | Subscriber | 95032 |
| 913455 | 307 | 8/31/2015 23:13 | Post at Kearny | 47 | 8/31/2015 23:18 | 2nd at South Park | 64 | 468 | Subscriber | 94107 |
| 913454 | 409 | 8/31/2015 23:10 | San Jose City Hall | 10 | 8/31/2015 23:17 | San Salvador at 1st | 8 | 68 | Subscriber | 95113 |
| 913453 | 789 | 8/31/2015 23:09 | Embarcadero at Folsom | 51 | 8/31/2015 23:22 | Embarcadero at Sansome | 60 | 487 | Customer | 9069 |
| 913452 | 293 | 8/31/2015 23:07 | Yerba Buena Center of the Arts (3rd @ Howard) | 68 | 8/31/2015 23:12 | San Francisco Caltrain (Townsend at 4th) | 70 | 538 | Subscriber | 94118 |
| 913451 | 896 | 8/31/2015 23:07 | Embarcadero at Folsom | 51 | 8/31/2015 23:22 | Embarcadero at Sansome | 60 | 363 | Customer | 92562 |
| 913450 | 255 | 8/31/2015 22:16 | Embarcadero at Sansome | 60 | 8/31/2015 22:20 | Steuart at Market | 74 | 470 | Subscriber | 94111 |
| 913449 | 126 | 8/31/2015 22:12 | Beale at Market | 56 | 8/31/2015 22:15 | Temporary Transbay Terminal (Howard at Beale) | 55 | 439 | Subscriber | 94130 |
| 913448 | 932 | 8/31/2015 21:57 | Post at Kearny | 47 | 8/31/2015 22:12 | South Van Ness at Market | 66 | 472 | Subscriber | 94702 |
... (354142 rows omitted)
tbl.with_column
tbl = Table()
tbl.with_column(name, values)
tbl.with_columns(n1, v1, n2, v2,...)
Creates a new table by adding a column with name name and values values to another table. name should be a string and values should have as many entries as there are rows in the original table. If values is a single value, then every row of that column has the value values.
In the examples below, we start with adding a column to the existing table trips with values being an array we construct from existing tables.
[32]:
trips.with_column(
    "Difference in terminal", abs(trips.column("Start Terminal") - trips.column("End Terminal"))
)
[32]:
| Trip ID | Duration | Start Date | Start Station | Start Terminal | End Date | End Station | End Terminal | Bike # | Subscriber Type | Zip Code | Difference in terminal |
|---|---|---|---|---|---|---|---|---|---|---|---|
| 876419 | 413 | 8/5/2015 8:29 | Civic Center BART (7th at Market) | 72 | 8/5/2015 8:36 | Townsend at 7th | 65 | 269 | Subscriber | 94518 | 7 |
| 459672 | 408 | 9/18/2014 17:11 | Harry Bridges Plaza (Ferry Building) | 50 | 9/18/2014 17:17 | Embarcadero at Sansome | 60 | 429 | Subscriber | 94111 | 10 |
| 903647 | 723 | 8/25/2015 7:26 | San Francisco Caltrain 2 (330 Townsend) | 69 | 8/25/2015 7:38 | Market at 10th | 67 | 631 | Subscriber | 94025 | 2 |
| 452829 | 409 | 9/15/2014 8:29 | Steuart at Market | 74 | 9/15/2014 8:36 | Market at 4th | 76 | 428 | Subscriber | 94925 | 2 |
| 491023 | 224 | 10/9/2014 16:13 | Santa Clara at Almaden | 4 | 10/9/2014 16:17 | San Jose Diridon Caltrain Station | 2 | 144 | Subscriber | 94117 | 2 |
| 723352 | 519 | 4/13/2015 17:04 | Howard at 2nd | 63 | 4/13/2015 17:12 | San Francisco Caltrain (Townsend at 4th) | 70 | 629 | Subscriber | 94061 | 7 |
| 524499 | 431 | 10/31/2014 16:36 | Townsend at 7th | 65 | 10/31/2014 16:43 | Civic Center BART (7th at Market) | 72 | 630 | Subscriber | 94706 | 7 |
| 518524 | 389 | 10/28/2014 8:48 | Market at Sansome | 77 | 10/28/2014 8:54 | 2nd at South Park | 64 | 458 | Subscriber | 94610 | 13 |
| 710070 | 11460 | 4/2/2015 18:13 | Powell Street BART | 39 | 4/2/2015 21:24 | Powell Street BART | 39 | 375 | Subscriber | 94107 | 0 |
| 793149 | 616 | 6/4/2015 5:26 | Embarcadero at Bryant | 54 | 6/4/2015 5:36 | Embarcadero at Sansome | 60 | 289 | Subscriber | 94105 | 6 |
... (99990 rows omitted)
We can also create a new table by adding two new columns with column name followed by the array values.
[33]:
cookies = Table()
cookies = cookies.with_columns(
    "Cookie", make_array("Sugar cookies", "Chocolate chip", "Red velvet", "Oatmeal raisin", "Peanut butter"),
    "Quantity", make_array(10, 15, 15, 10, 5)
)
cookies
[33]:
| Cookie | Quantity |
|---|---|
| Sugar cookies | 10 |
| Chocolate chip | 15 |
| Red velvet | 15 |
| Oatmeal raisin | 10 |
| Peanut butter | 5 |
[34]:
prices = make_array(1.00, 1.50, 1.75, 1.25, 1.00)
cookies = cookies.with_column("Price ($)", prices)
cookies
[34]:
| Cookie | Quantity | Price ($) |
|---|---|---|
| Sugar cookies | 10 | 1 |
| Chocolate chip | 15 | 1.5 |
| Red velvet | 15 | 1.75 |
| Oatmeal raisin | 10 | 1.25 |
| Peanut butter | 5 | 1 |
In the last examples, we add a new column Delicious with one value “yes,” and we see every column has the same value.
[35]:
cookies.with_column("Delicious", "yes")
[35]:
| Cookie | Quantity | Price ($) | Delicious |
|---|---|---|---|
| Sugar cookies | 10 | 1 | yes |
| Chocolate chip | 15 | 1.5 | yes |
| Red velvet | 15 | 1.75 | yes |
| Oatmeal raisin | 10 | 1.25 | yes |
| Peanut butter | 5 | 1 | yes |
tbl.column()
tbl.column(column_name_or_index)
Outputs an array of values of the column column_name_or_index. column_name_or_index is a string of the column name or number which is the index of the column.
In the examples below, we start with an array of the Cookie column from the table cookies first by the column name then by using the index of the column.
[36]:
cookies.column("Cookie")
[36]:
array(['Sugar cookies', 'Chocolate chip', 'Red velvet', 'Oatmeal raisin',
       'Peanut butter'], dtype='<U14')
[37]:
cookies.column(0)
[37]:
array(['Sugar cookies', 'Chocolate chip', 'Red velvet', 'Oatmeal raisin',
       'Peanut butter'], dtype='<U14')
tbl.num_rows
Computes the number of rows in a table.
[38]:
trips.num_rows
[38]:
100000
[39]:
cookies.num_rows
[39]:
5
tbl.num_columns
Computes the number of columns in a table.
[40]:
trips.num_columns
[40]:
11
[41]:
cookies.num_columns
[41]:
3
tbl.labels
Outputs the column labels in a table.
[42]:
trips.labels
[42]:
('Trip ID',
 'Duration',
 'Start Date',
 'Start Station',
 'Start Terminal',
 'End Date',
 'End Station',
 'End Terminal',
 'Bike #',
 'Subscriber Type',
 'Zip Code')
[43]:
cookies.labels
[43]:
('Cookie', 'Quantity', 'Price ($)')
tbl.select()
tbl.select(col1, col2, ...)
Creates a copy of a table with only the selected columns. Each column is the column name as a string or the integer index of the column.
Suppose we want to select the Trip ID, Duration, Bike #, and Zip Code columns from the trips table.
[44]:
trips.select("Trip ID", "Duration", "Bike #", "Zip Code")
[44]:
| Trip ID | Duration | Bike # | Zip Code |
|---|---|---|---|
| 876419 | 413 | 269 | 94518 |
| 459672 | 408 | 429 | 94111 |
| 903647 | 723 | 631 | 94025 |
| 452829 | 409 | 428 | 94925 |
| 491023 | 224 | 144 | 94117 |
| 723352 | 519 | 629 | 94061 |
| 524499 | 431 | 630 | 94706 |
| 518524 | 389 | 458 | 94610 |
| 710070 | 11460 | 375 | 94107 |
| 793149 | 616 | 289 | 94105 |
... (99990 rows omitted)
Similarly, we can use indexes to select columns. Remember to start indexing at 0.
[45]:
trips.select(0, 1, 8, 10).show(5)
| Trip ID | Duration | Bike # | Zip Code |
|---|---|---|---|
| 876419 | 413 | 269 | 94518 |
| 459672 | 408 | 429 | 94111 |
| 903647 | 723 | 631 | 94025 |
| 452829 | 409 | 428 | 94925 |
| 491023 | 224 | 144 | 94117 |
... (99995 rows omitted)
tbl.drop()
tbl.drop(col1, col2, ...)
Creates a copy of a table without the specified columns. Each column is the column name as a string or integer index.
[46]:
cookies.drop("Quantity")
[46]:
| Cookie | Price ($) |
|---|---|
| Sugar cookies | 1 |
| Chocolate chip | 1.5 |
| Red velvet | 1.75 |
| Oatmeal raisin | 1.25 |
| Peanut butter | 1 |
[47]:
trips.drop("End Date", "Subscriber Type")
[47]:
| Trip ID | Duration | Start Date | Start Station | Start Terminal | End Station | End Terminal | Bike # | Zip Code |
|---|---|---|---|---|---|---|---|---|
| 876419 | 413 | 8/5/2015 8:29 | Civic Center BART (7th at Market) | 72 | Townsend at 7th | 65 | 269 | 94518 |
| 459672 | 408 | 9/18/2014 17:11 | Harry Bridges Plaza (Ferry Building) | 50 | Embarcadero at Sansome | 60 | 429 | 94111 |
| 903647 | 723 | 8/25/2015 7:26 | San Francisco Caltrain 2 (330 Townsend) | 69 | Market at 10th | 67 | 631 | 94025 |
| 452829 | 409 | 9/15/2014 8:29 | Steuart at Market | 74 | Market at 4th | 76 | 428 | 94925 |
| 491023 | 224 | 10/9/2014 16:13 | Santa Clara at Almaden | 4 | San Jose Diridon Caltrain Station | 2 | 144 | 94117 |
| 723352 | 519 | 4/13/2015 17:04 | Howard at 2nd | 63 | San Francisco Caltrain (Townsend at 4th) | 70 | 629 | 94061 |
| 524499 | 431 | 10/31/2014 16:36 | Townsend at 7th | 65 | Civic Center BART (7th at Market) | 72 | 630 | 94706 |
| 518524 | 389 | 10/28/2014 8:48 | Market at Sansome | 77 | 2nd at South Park | 64 | 458 | 94610 |
| 710070 | 11460 | 4/2/2015 18:13 | Powell Street BART | 39 | Powell Street BART | 39 | 375 | 94107 |
| 793149 | 616 | 6/4/2015 5:26 | Embarcadero at Bryant | 54 | Embarcadero at Sansome | 60 | 289 | 94105 |
... (99990 rows omitted)
[48]:
trips.drop(3, 6, 8, 9, 10)
[48]:
| Trip ID | Duration | Start Date | Start Terminal | End Date | End Terminal |
|---|---|---|---|---|---|
| 876419 | 413 | 8/5/2015 8:29 | 72 | 8/5/2015 8:36 | 65 |
| 459672 | 408 | 9/18/2014 17:11 | 50 | 9/18/2014 17:17 | 60 |
| 903647 | 723 | 8/25/2015 7:26 | 69 | 8/25/2015 7:38 | 67 |
| 452829 | 409 | 9/15/2014 8:29 | 74 | 9/15/2014 8:36 | 76 |
| 491023 | 224 | 10/9/2014 16:13 | 4 | 10/9/2014 16:17 | 2 |
| 723352 | 519 | 4/13/2015 17:04 | 63 | 4/13/2015 17:12 | 70 |
| 524499 | 431 | 10/31/2014 16:36 | 65 | 10/31/2014 16:43 | 72 |
| 518524 | 389 | 10/28/2014 8:48 | 77 | 10/28/2014 8:54 | 64 |
| 710070 | 11460 | 4/2/2015 18:13 | 39 | 4/2/2015 21:24 | 39 |
| 793149 | 616 | 6/4/2015 5:26 | 54 | 6/4/2015 5:36 | 60 |
... (99990 rows omitted)
tbl.relabel()
tbl.relabel(old_label, new_label)
Modifies the table by changing the label of the column named old_label to new_label. old_label can be a string column name or an integer index.
[49]:
cookies
[49]:
| Cookie | Quantity | Price ($) |
|---|---|---|
| Sugar cookies | 10 | 1 |
| Chocolate chip | 15 | 1.5 |
| Red velvet | 15 | 1.75 |
| Oatmeal raisin | 10 | 1.25 |
| Peanut butter | 5 | 1 |
[50]:
cookies.relabel("Quantity", "Amount remaining")
[50]:
| Cookie | Amount remaining | Price ($) |
|---|---|---|
| Sugar cookies | 10 | 1 |
| Chocolate chip | 15 | 1.5 |
| Red velvet | 15 | 1.75 |
| Oatmeal raisin | 10 | 1.25 |
| Peanut butter | 5 | 1 |
[51]:
cookies.relabel(0, "Type")
[51]:
| Type | Amount remaining | Price ($) |
|---|---|---|
| Sugar cookies | 10 | 1 |
| Chocolate chip | 15 | 1.5 |
| Red velvet | 15 | 1.75 |
| Oatmeal raisin | 10 | 1.25 |
| Peanut butter | 5 | 1 |
[52]:
cookies
[52]:
| Type | Amount remaining | Price ($) |
|---|---|---|
| Sugar cookies | 10 | 1 |
| Chocolate chip | 15 | 1.5 |
| Red velvet | 15 | 1.75 |
| Oatmeal raisin | 10 | 1.25 |
| Peanut butter | 5 | 1 |
tbl.show()
tbl.show(n)
Displays the first n rows of a table. If no n is provided, displays all rows.
[53]:
trips.show(5)
| Trip ID | Duration | Start Date | Start Station | Start Terminal | End Date | End Station | End Terminal | Bike # | Subscriber Type | Zip Code |
|---|---|---|---|---|---|---|---|---|---|---|
| 876419 | 413 | 8/5/2015 8:29 | Civic Center BART (7th at Market) | 72 | 8/5/2015 8:36 | Townsend at 7th | 65 | 269 | Subscriber | 94518 |
| 459672 | 408 | 9/18/2014 17:11 | Harry Bridges Plaza (Ferry Building) | 50 | 9/18/2014 17:17 | Embarcadero at Sansome | 60 | 429 | Subscriber | 94111 |
| 903647 | 723 | 8/25/2015 7:26 | San Francisco Caltrain 2 (330 Townsend) | 69 | 8/25/2015 7:38 | Market at 10th | 67 | 631 | Subscriber | 94025 |
| 452829 | 409 | 9/15/2014 8:29 | Steuart at Market | 74 | 9/15/2014 8:36 | Market at 4th | 76 | 428 | Subscriber | 94925 |
| 491023 | 224 | 10/9/2014 16:13 | Santa Clara at Almaden | 4 | 10/9/2014 16:17 | San Jose Diridon Caltrain Station | 2 | 144 | Subscriber | 94117 |
... (99995 rows omitted)
tbl.sort()
tbl.sort(column_name_or_index, descending=False)
Sorts the rows in the table by the values in the column column_name_or_index in ascending order by default. Set descending=True to sort in descending order. column_name_or_index can be a string column label or an integer index.
[54]:
cookies
[54]:
| Type | Amount remaining | Price ($) |
|---|---|---|
| Sugar cookies | 10 | 1 |
| Chocolate chip | 15 | 1.5 |
| Red velvet | 15 | 1.75 |
| Oatmeal raisin | 10 | 1.25 |
| Peanut butter | 5 | 1 |
[55]:
cookies.sort("Price ($)")
[55]:
| Type | Amount remaining | Price ($) |
|---|---|---|
| Sugar cookies | 10 | 1 |
| Peanut butter | 5 | 1 |
| Oatmeal raisin | 10 | 1.25 |
| Chocolate chip | 15 | 1.5 |
| Red velvet | 15 | 1.75 |
[56]:
# sort in descending order
cookies.sort("Amount remaining", descending = True)
[56]:
| Type | Amount remaining | Price ($) |
|---|---|---|
| Red velvet | 15 | 1.75 |
| Chocolate chip | 15 | 1.5 |
| Oatmeal raisin | 10 | 1.25 |
| Sugar cookies | 10 | 1 |
| Peanut butter | 5 | 1 |
[57]:
# alphabetical order
cookies.sort(0)
[57]:
| Type | Amount remaining | Price ($) |
|---|---|---|
| Chocolate chip | 15 | 1.5 |
| Oatmeal raisin | 10 | 1.25 |
| Peanut butter | 5 | 1 |
| Red velvet | 15 | 1.75 |
| Sugar cookies | 10 | 1 |
tbl.where()
tbl.where(column, predicate)
Filters the table for rows where the predicate is true. predicate should be one of the provided are.<something> functions. column can be a string column label or an integer index. A list of available predicates can be found below.
[58]:
cookies.where("Amount remaining", are.above(10))
[58]:
| Type | Amount remaining | Price ($) |
|---|---|---|
| Chocolate chip | 15 | 1.5 |
| Red velvet | 15 | 1.75 |
[59]:
cookies.where(0, are.equal_to("Chocolate chip"))
[59]:
| Type | Amount remaining | Price ($) |
|---|---|---|
| Chocolate chip | 15 | 1.5 |
[62]:
# if predicate is a value, look for rows where the column == the value
# equivalent to cookies.where(1, are.eual_to(15))
cookies.where(1, 15)
[62]:
| Type | Amount remaining | Price ($) |
|---|---|---|
| Chocolate chip | 15 | 1.5 |
| Red velvet | 15 | 1.75 |
[63]:
cookies.where("Price ($)", are.below(1.25))
[63]:
| Type | Amount remaining | Price ($) |
|---|---|---|
| Sugar cookies | 10 | 1 |
| Peanut butter | 5 | 1 |
tbl.take()
tbl.take(row_index, ...)
Returns a copy of the table with only the specified rows included. Rows are specified by their integer index, so 0 for the first, 1 for the second, etc.
[64]:
cookies
[64]:
| Type | Amount remaining | Price ($) |
|---|---|---|
| Sugar cookies | 10 | 1 |
| Chocolate chip | 15 | 1.5 |
| Red velvet | 15 | 1.75 |
| Oatmeal raisin | 10 | 1.25 |
| Peanut butter | 5 | 1 |
[65]:
cookies.take(0)
[65]:
| Type | Amount remaining | Price ($) |
|---|---|---|
| Sugar cookies | 10 | 1 |
[66]:
cookies.take(cookies.num_rows - 1)
[66]:
| Type | Amount remaining | Price ($) |
|---|---|---|
| Peanut butter | 5 | 1 |
[67]:
cookies.take(0, 1, 2)
[67]:
| Type | Amount remaining | Price ($) |
|---|---|---|
| Sugar cookies | 10 | 1 |
| Chocolate chip | 15 | 1.5 |
| Red velvet | 15 | 1.75 |
Table Visualizations
[4]:
actors = Table().read_table("https://raw.githubusercontent.com/data-8/textbook/refs/heads/main/assets/data/actors.csv")
actors
[4]:
| Actor | Total Gross | Number of Movies | Average per Movie | #1 Movie | Gross |
|---|---|---|---|---|---|
| Harrison Ford | 4871.7 | 41 | 118.8 | Star Wars: The Force Awakens | 936.7 |
| Samuel L. Jackson | 4772.8 | 69 | 69.2 | The Avengers | 623.4 |
| Morgan Freeman | 4468.3 | 61 | 73.3 | The Dark Knight | 534.9 |
| Tom Hanks | 4340.8 | 44 | 98.7 | Toy Story 3 | 415 |
| Robert Downey, Jr. | 3947.3 | 53 | 74.5 | The Avengers | 623.4 |
| Eddie Murphy | 3810.4 | 38 | 100.3 | Shrek 2 | 441.2 |
| Tom Cruise | 3587.2 | 36 | 99.6 | War of the Worlds | 234.3 |
| Johnny Depp | 3368.6 | 45 | 74.9 | Dead Man's Chest | 423.3 |
| Michael Caine | 3351.5 | 58 | 57.8 | The Dark Knight | 534.9 |
| Scarlett Johansson | 3341.2 | 37 | 90.3 | The Avengers | 623.4 |
... (40 rows omitted)
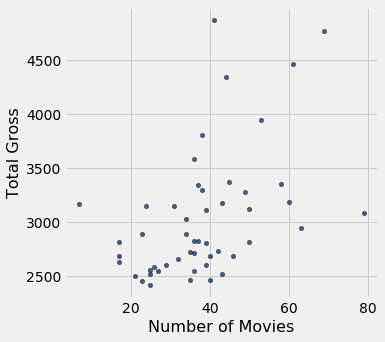
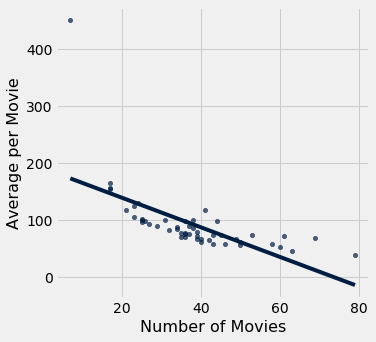
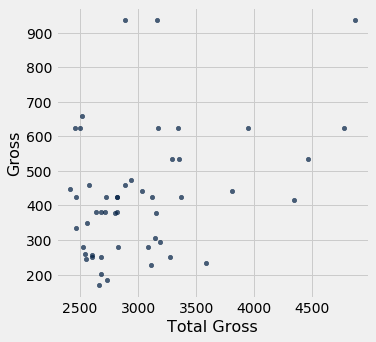
tbl.scatter()
tbl.scatter(x_column, y_column, fit_line=False)
Creates a scatter plot with x_column on the horizontal axis and y_column on the vertical axis. These labels can be column names as strings or integer indices. Set fit_line=True to include a line of best fit for the data. You can find more examples in the textbook.
[71]:
actors.scatter('Number of Movies', 'Total Gross')
[73]:
actors.scatter(2, 3, fit_line=True)
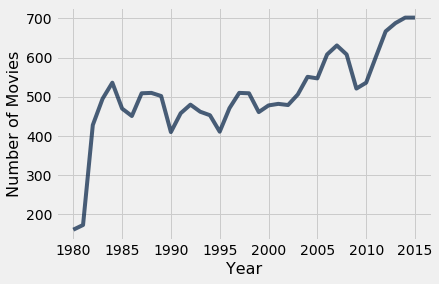
tbl.plot()
tbl.plot(x_column, y_column)
Plot a line graph with x_column on the horizontal axis and y_column on the vertical axis. Sorts the table in ascending order by values in x_column first. x_column and y_column can be column names as strings or integer indices.
[5]:
movies_by_year = Table.read_table('https://raw.githubusercontent.com/data-8/textbook/refs/heads/main/assets/data/movies_by_year.csv')
movies_by_year.show(3)
| Year | Total Gross | Number of Movies | #1 Movie |
|---|---|---|---|
| 2015 | 11128.5 | 702 | Star Wars: The Force Awakens |
| 2014 | 10360.8 | 702 | American Sniper |
| 2013 | 10923.6 | 688 | Catching Fire |
... (33 rows omitted)
[75]:
movies_by_year.plot('Year', 'Number of Movies')
tbl.barh()
tbl.barh(categories)
tbl.barh(categories, values)
Plots a horizontal bar chart broken down by categories as the bars. If values is unspecified, one bar for each column of the table (except categories) is plotted. categories and values can be column names as strings or integer indices.
[76]:
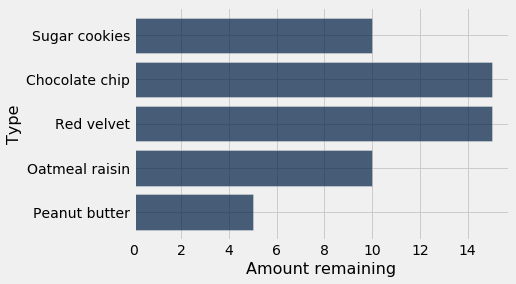
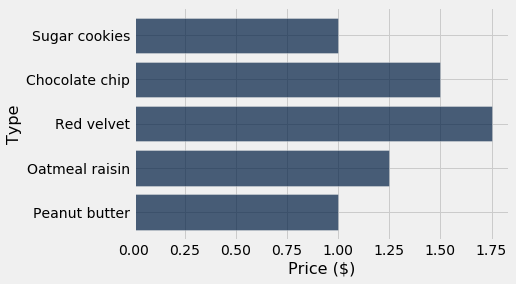
cookies.barh("Type")
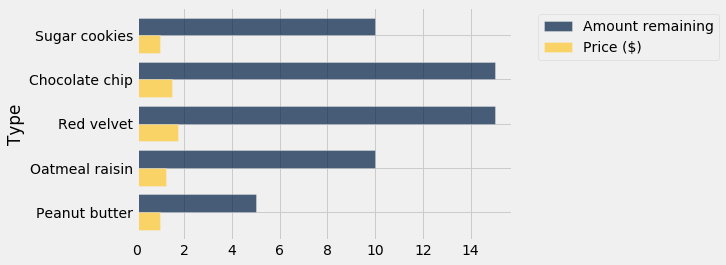
[77]:
cookies.barh("Type", "Amount remaining")
[78]:
cookies.barh(0, 2)
tbl.hist()
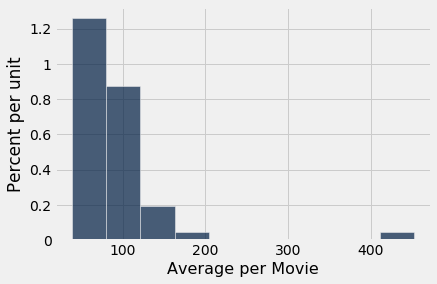
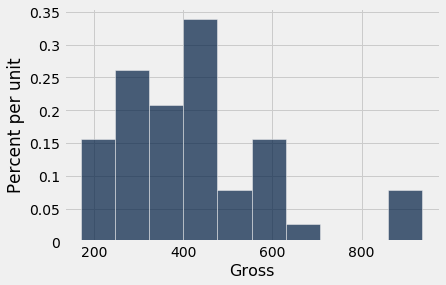
tbl.hist(column)
tbl.hist(column, bins=...)
Plot a histogram of the values in column. Defaults to 10 bins of equal width. If bins is specified, it can be a number of bins to use (e.g. bins=25 will produce a histogram with 25 bins) or an array of values to use as bins (e.g. bins=make_array(1, 3, 4) will produce 2 bins: \([1, 3)\) and \([3, 4)\)). column can be column names as strings or integer indices.
[79]:
actors.hist(3)
[80]:
actors.hist("Gross")
Using group with Table.hist
You can also group the histogram by a categorical column using group=:
The number of columns must be one, and you can’t use bin_column with group.
[ ]:
students = Table().with_columns(
    'Score', np.concatenate([
        np.random.normal(75, 10, 500),  # Group X: higher average score
        np.random.normal(65, 10, 500)   # Group Y: lower average score
    ]),
    'Group', ['X'] * 500 + ['Y'] * 500  # Assign 500 Xs and 500 Ys
)

students.hist('Score', group='Group')  # Plot histogram grouped by 'Group'
Table.interactive_plots()
Table.interactive_plots()
This function will change from static plots like the ones above to interactive plots made with plotly. If a plotting method has a plotly version, that method will be used instead.
[193]:
Table.interactive_plots()
actors.scatter("Total Gross", "Gross")
Table.static_plots()
Table.static_plots()
This function turns off plotly plots.
[194]:
Table.static_plots()
actors.scatter("Total Gross", "Gross")
Advanced Table Functions
tbl.apply()
tbl.apply(function, column)
tbl.apply(function, col1, col2, ...)
Applies the function function to each element of the column column and returns the values returned as an array. If function takes more than one argument, you can specify multiple columns to use for each argument in order.
[65]:
actors.apply(np.average, "Number of Movies")
[65]:
array([41., 69., 61., 44., 53., 38., 36., 45., 58., 37., 38., 49., 60.,
       43.,  7., 31., 24., 50., 39., 79., 34., 63., 23., 34., 37., 36.,
       17., 50., 39., 42., 35., 36., 17., 46., 40., 32., 17., 29., 39.,
       26., 25., 36., 27., 43., 25., 21., 40., 35., 23., 25.])
[82]:
actors
[82]:
| Actor | Total Gross | Number of Movies | Average per Movie | #1 Movie | Gross |
|---|---|---|---|---|---|
| Harrison Ford | 4871.7 | 41 | 118.8 | Star Wars: The Force Awakens | 936.7 |
| Samuel L. Jackson | 4772.8 | 69 | 69.2 | The Avengers | 623.4 |
| Morgan Freeman | 4468.3 | 61 | 73.3 | The Dark Knight | 534.9 |
| Tom Hanks | 4340.8 | 44 | 98.7 | Toy Story 3 | 415 |
| Robert Downey, Jr. | 3947.3 | 53 | 74.5 | The Avengers | 623.4 |
| Eddie Murphy | 3810.4 | 38 | 100.3 | Shrek 2 | 441.2 |
| Tom Cruise | 3587.2 | 36 | 99.6 | War of the Worlds | 234.3 |
| Johnny Depp | 3368.6 | 45 | 74.9 | Dead Man's Chest | 423.3 |
| Michael Caine | 3351.5 | 58 | 57.8 | The Dark Knight | 534.9 |
| Scarlett Johansson | 3341.2 | 37 | 90.3 | The Avengers | 623.4 |
... (40 rows omitted)
The example below calculates the average gross for each movie by actor by applying a function that takes in the value of Total Gross and Number of Movies and returns their quotient.
[83]:
def average_gross(total_gross, num_movies):
    return total_gross / num_movies

actors.apply(average_gross, "Total Gross", "Number of Movies")
[83]:
array([118.82195122,  69.17101449,  73.25081967,  98.65454545,
        74.47735849, 100.27368421,  99.64444444,  74.85777778,
        57.78448276,  90.3027027 ,  86.68421053,  66.9244898 ,
        53.15666667,  73.8372093 , 451.84285714, 101.62580645,
       131.2125    ,  62.478     ,  79.67435897,  39.00379747,
        89.16764706,  46.70952381, 125.67826087,  84.86470588,
        76.40540541,  78.38888889, 165.63529412,  56.316     ,
        71.86153846,  65.12619048,  77.89428571,  75.425     ,
       157.75882353,  58.28913043,  67.0225    ,  83.15625   ,
       154.96470588,  89.83103448,  66.72564103,  99.25384615,
       102.308     ,  70.82777778,  94.26666667,  58.65348837,
       100.732     , 119.06190476,  61.5925    ,  70.36      ,
       106.86086957,  96.66      ])
tbl.group()
tbl.group(column_or_columns)
tbl.group(column_or_columns, func)
Groups a table by values in column_or_columns. If column_or_columns is an array, groups by each unique combination of elements in those columns. If func is specified, it should be a function that takes in an array of values and returns a single value. If unspecified, this defaults to the count of rows in the set.
[84]:
trips.group("Start Station")
[84]:
| Start Station | count |
|---|---|
| 2nd at Folsom | 2302 |
| 2nd at South Park | 2610 |
| 2nd at Townsend | 3904 |
| 5th at Howard | 2190 |
| Adobe on Almaden | 165 |
| Arena Green / SAP Center | 176 |
| Beale at Market | 2377 |
| Broadway St at Battery St | 2157 |
| California Ave Caltrain Station | 127 |
| Castro Street and El Camino Real | 339 |
... (60 rows omitted)
[85]:
trips.group("Start Station", np.mean).select(0,2)
[85]:
| Start Station | Duration mean |
|---|---|
| 2nd at Folsom | 512.887 |
| 2nd at South Park | 654.565 |
| 2nd at Townsend | 755.176 |
| 5th at Howard | 819.509 |
| Adobe on Almaden | 2522.5 |
| Arena Green / SAP Center | 1999.7 |
| Beale at Market | 679.602 |
| Broadway St at Battery St | 827.753 |
| California Ave Caltrain Station | 4403.29 |
| Castro Street and El Camino Real | 1221.86 |
... (60 rows omitted)
[86]:
trips.group("Start Station").sort("count", descending = True)
[86]:
| Start Station | count |
|---|---|
| San Francisco Caltrain (Townsend at 4th) | 7426 |
| San Francisco Caltrain 2 (330 Townsend) | 6114 |
| Harry Bridges Plaza (Ferry Building) | 4795 |
| Temporary Transbay Terminal (Howard at Beale) | 4212 |
| Townsend at 7th | 3925 |
| 2nd at Townsend | 3904 |
| Embarcadero at Sansome | 3900 |
| Steuart at Market | 3872 |
| Market at 10th | 3370 |
| Market at Sansome | 3218 |
... (60 rows omitted)
[87]:
trips.group(['Start Station', 'End Station'])
[87]:
| Start Station | End Station | count |
|---|---|---|
| 2nd at Folsom | 2nd at Folsom | 22 |
| 2nd at Folsom | 2nd at South Park | 84 |
| 2nd at Folsom | 2nd at Townsend | 123 |
| 2nd at Folsom | 5th at Howard | 28 |
| 2nd at Folsom | Beale at Market | 34 |
| 2nd at Folsom | Broadway St at Battery St | 18 |
| 2nd at Folsom | Civic Center BART (7th at Market) | 13 |
| 2nd at Folsom | Clay at Battery | 70 |
| 2nd at Folsom | Commercial at Montgomery | 46 |
| 2nd at Folsom | Davis at Jackson | 8 |
... (1616 rows omitted)
tbl.pivot()
tbl.pivot(col1, col2)
tbl.pivot(col1, col2, values, collect)
Creates a pivot table with values in col1 as columns and values in col2 as rows. If values is unspecified, the values in the cells default to counts. If values is specified, it should be the label of a column whose values to pass as an array to collect, which should return a single value.
[88]:
more_cones = Table().with_columns(
    'Flavor', make_array('strawberry', 'chocolate', 'chocolate', 'strawberry', 'chocolate', 'bubblegum'),
    'Color', make_array('pink', 'light brown', 'dark brown', 'pink', 'dark brown', 'pink'),
    'Price', make_array(3.55, 4.75, 5.25, 5.25, 5.25, 4.75)
)

more_cones
[88]:
| Flavor | Color | Price |
|---|---|---|
| strawberry | pink | 3.55 |
| chocolate | light brown | 4.75 |
| chocolate | dark brown | 5.25 |
| strawberry | pink | 5.25 |
| chocolate | dark brown | 5.25 |
| bubblegum | pink | 4.75 |
[89]:
more_cones.pivot('Flavor', 'Color')
[89]:
| Color | bubblegum | chocolate | strawberry |
|---|---|---|---|
| dark brown | 0 | 2 | 0 |
| light brown | 0 | 1 | 0 |
| pink | 1 | 0 | 2 |
[90]:
more_cones.pivot('Flavor', 'Color', values='Price', collect=sum)
[90]:
| Color | bubblegum | chocolate | strawberry |
|---|---|---|---|
| dark brown | 0 | 10.5 | 0 |
| light brown | 0 | 4.75 | 0 |
| pink | 4.75 | 0 | 8.8 |
[91]:
more_cones.pivot(0, 1)
[91]:
| Color | bubblegum | chocolate | strawberry |
|---|---|---|---|
| dark brown | 0 | 2 | 0 |
| light brown | 0 | 1 | 0 |
| pink | 1 | 0 | 2 |
tbl.join()
tbl1.join(col1, tbl2)
tbl1.join(col1, tbl2, col2)
Performs a join of tbl1 on tbl2 where rows are only included if the value in col1 is present in both join columns. If col2 is unspecified, it is assumed to be the same label as col1.
[92]:
cones = Table().with_columns(
    'Flavor', make_array('strawberry', 'vanilla', 'chocolate', 'strawberry', 'chocolate'),
    'Price', make_array(3.55, 4.75, 6.55, 5.25, 5.75)
)
cones
[92]:
| Flavor | Price |
|---|---|
| strawberry | 3.55 |
| vanilla | 4.75 |
| chocolate | 6.55 |
| strawberry | 5.25 |
| chocolate | 5.75 |
[95]:
ratings = Table().with_columns(
    'Kind', make_array('strawberry', 'chocolate', 'vanilla', 'mint chip'),
    'Stars', make_array(2.5, 3.5, 4, 3)
)
ratings
[95]:
| Kind | Stars |
|---|---|
| strawberry | 2.5 |
| chocolate | 3.5 |
| vanilla | 4 |
| mint chip | 3 |
[97]:
# Joins cones on ratings. Note that the mint chip flavor doesn't appear since it's not in cones
rated = cones.join('Flavor', ratings, 'Kind')
rated
[97]:
| Flavor | Price | Stars |
|---|---|---|
| chocolate | 6.55 | 3.5 |
| chocolate | 5.75 | 3.5 |
| strawberry | 3.55 | 2.5 |
| strawberry | 5.25 | 2.5 |
| vanilla | 4.75 | 4 |
tbl.sample()
tbl.sample(k, with_replacement=True)
Returns a new table with k rows that were randomly sampled from the original table. If with_replacement is true, sampling occurs with replacement. For sampling without replacement, set with_replacement=False.
[98]:
# if you rerun this cell, you should get different results since the sample is random
rated.sample(2)
[98]:
| Flavor | Price | Stars |
|---|---|---|
| chocolate | 6.55 | 3.5 |
| chocolate | 6.55 | 3.5 |
Notice how the table below has more rows for certain flavors than the original rated table. This is because we are sampling with replacement, so you get theoretically get 5 of the same flavors!
[99]:
sampled_with_replacement = rated.sample(5)
sampled_with_replacement
[99]:
| Flavor | Price | Stars |
|---|---|---|
| strawberry | 5.25 | 2.5 |
| strawberry | 3.55 | 2.5 |
| strawberry | 3.55 | 2.5 |
| chocolate | 6.55 | 3.5 |
| vanilla | 4.75 | 4 |
[100]:
rated.sample(3, with_replacement = False)
[100]:
| Flavor | Price | Stars |
|---|---|---|
| vanilla | 4.75 | 4 |
| strawberry | 3.55 | 2.5 |
| chocolate | 6.55 | 3.5 |
String Methods
str.split()
string.split(separator)
Splits the string string into a list on each occurence of the substring separator. The occurences of separator are removed from the resulting list.
For example, the code below splits the string Data 8hiishifun. on the substring hi.
[101]:
example_string = "Data 8hiishifun."
example_string.split("hi")
[101]:
['Data 8', 'is', 'fun.']
[104]:
# split on .
another_string = "the.secret.message.is.123"
another_string.split(".")
[104]:
['the', 'secret', 'message', 'is', '123']
str.join()
string.join(array)
Combines each element of array into one string with string used to connect each element.
[105]:
fun_array = make_array("high", "great", "best")
"est ".join(fun_array)
[105]:
'highest greatest best'
[106]:
# you can join elements on the empty string to just merge the elements
some_strings = make_array("some", "list", "of", "strings")
"".join(some_strings)
[106]:
'somelistofstrings'
str.replace()
string.replace(old_string, new_string)
Replaces each occurrence of old_string in string with new_string.
[107]:
berkeley_string = "I saw 5 friends, 10 squirrels, and 20 people flyering on Sproul."
berkeley_string
[107]:
'I saw 5 friends, 10 squirrels, and 20 people flyering on Sproul.'
[108]:
berkeley_string.replace("friends", "frisbees")
[108]:
'I saw 5 frisbees, 10 squirrels, and 20 people flyering on Sproul.'
[110]:
# you can chain calls to .replace() since the return value is also a string
berkeley_string.replace("friends", "frisbees").replace("flyering on Sproul", "having a picnic on the Glade")
[110]:
'I saw 5 frisbees, 10 squirrels, and 20 people having a picnic on the Glade.'
Array Functions and Methods
[111]:
example_array = make_array(1, 3, 5, 7, 9)
example_array
[111]:
array([1, 3, 5, 7, 9])
max()
max(array)
Returns the maximum value of an array.
[112]:
max(example_array)
[112]:
9
min()
min(array)
Returns the minimum value of an array.
[113]:
min(example_array)
[113]:
1
sum()
sum(array)
Returns the sum of values in an array.
[114]:
sum(example_array)
[114]:
25
[115]:
sum(make_array(1, 2, 0, -10))
[115]:
-7
abs()
abs(num)
abs(array)
Take the absolute value of number or each number in an array.
[118]:
abs(-1)
[118]:
1
[119]:
new_arr = make_array(-3, -1, 5.2, 0.25, -4.9)
abs(new_arr)
[119]:
array([3. , 1. , 5.2 , 0.25, 4.9 ])
round(num)
round(num)
round(num, d)
np.round(array)
np.round(array, d)
Round number or array of numbers to the nearest integer. If d is specified, rounds to d places after the decimal. Use np.round to round arrays.
[124]:
round(3.14159)
[124]:
3
[125]:
round(3.14159, 3)
[125]:
3.142
[130]:
np.round(new_arr, 1)
[130]:
array([-3. , -1. , 5.2, 0.2, -4.9])
len()
len(array)
Returns the length of an array.
[131]:
len(new_arr)
[131]:
5
make_array()
make_array(val1, val2, ...)
Creates a new array with the values passed.
[132]:
new_array = make_array(25, 16, 9, 4, 1)
new_array
[132]:
array([25, 16, 9, 4, 1])
np.mean
np.mean(array)
np.average(array)
Returns the mean of the values in an array.
[134]:
np.mean(new_array)
[134]:
11.0
[133]:
np.average(new_array)
[133]:
11.0
np.std()
np.std(array)
Returns the standard deviation of the values in an array.
[150]:
np.std(new_array)
[150]:
8.648699324175862
np.diff()
np.diff(array)
Returns an array with the pairwise differences between elements in the input array. The output will have length len(array) - 1 and will have elements \(x_1 - x_0\), \(x_2 - x_1\), \(x_3 - x_2\), etc.
[135]:
np.diff(new_array)
[135]:
array([-9, -7, -5, -3])
[136]:
np.diff(make_array(1, 3, 5, 7))
[136]:
array([2, 2, 2])
np.sqrt()
np.sqrt(num)
np.sqrt(array)
Returns the square root of a number or an array of the square roots of each element in the input array.
[137]:
np.sqrt(4)
[137]:
2.0
[138]:
np.sqrt(new_array)
[138]:
array([5., 4., 3., 2., 1.])
np.arange()
np.arange(stop)
np.arange(start, stop)
np.arange(start, stop, step)
Returns an array of integers from start to stop incrementing by step. If start is unspecified, it is assumed be 0. If step is unspecified, it is assumed to be 1. The upper bound is exclusive, meaning that max(np.arange(10)) is 9.
[139]:
np.arange(0, 11)
[139]:
array([ 0, 1, 2, 3, 4, 5, 6, 7, 8, 9, 10])
[140]:
np.arange(5)
[140]:
array([0, 1, 2, 3, 4])
[142]:
np.arange(0, 102, 2.7)
[142]:
array([ 0. ,  2.7,  5.4,  8.1, 10.8, 13.5, 16.2, 18.9, 21.6, 24.3, 27. ,
       29.7, 32.4, 35.1, 37.8, 40.5, 43.2, 45.9, 48.6, 51.3, 54. , 56.7,
       59.4, 62.1, 64.8, 67.5, 70.2, 72.9, 75.6, 78.3, 81. , 83.7, 86.4,
       89.1, 91.8, 94.5, 97.2, 99.9])
array.item()
array.item(num)
Returns the item at index num in an array (remember Python indices start at 0!).
[143]:
np.arange(0, 102, 2).item(1)
[143]:
2
[146]:
new_array.item(2)
[146]:
9
[147]:
new_array.item(len(new_array) - 1)
[147]:
1
np.random.choice
np.random.choice(array)
np.random.choice(array, n, replace=True)
Picks one or n of items from an array at random. By default, with replacement (set replace=False for without replacement).
[149]:
np.random.choice(new_array)
[149]:
25
[150]:
np.random.choice(new_array, 3)
[150]:
array([ 4, 4, 16])
[152]:
np.random.choice(np.arange(0, 102, 2), 10, replace=False)
[152]:
array([ 98, 22, 12, 56, 24, 54, 100, 52, 28, 88])
np.count_nonzero()
Returns the number of nonzero elements in an array. Because False values are considered zeros (as integers), this can also give you the number of Trues in an array of boolean valuea.
[153]:
another_array = make_array(0, 1, 2, 0, 4, 0, 1, 0, 0)
np.count_nonzero(another_array)
[153]:
4
[159]:
bools = make_array(True, False, True, False, False, True, False)
np.count_nonzero(bools)
[159]:
3
np.append()
np.append(array, item)
Returns a copy of the input array with item (must be the same type as the other entries in the array) appended to the end.
[160]:
new_array
[160]:
array([25, 16, 9, 4, 1])
[161]:
np.append(new_array, 1000)
[161]:
array([ 25, 16, 9, 4, 1, 1000])
percentile()
percentile(percent, array)
Returns the value corresponding to the specified percentile of an array. percent should be in percentage form (i.e. 50 not 0.5).
[162]:
long_array = make_array(1, 1, 1, 2, 2, 2, 3, 3, 3, 4)
long_array
[162]:
array([1, 1, 1, 2, 2, 2, 3, 3, 3, 4])
[163]:
percentile(50, long_array)
[163]:
2
[164]:
percentile(90, long_array)
[164]:
3
Table.where Predicates
All of the predicates described below can be negated by preceding the name with not_. For example, we can find values not equal to a specific value using are.not_equal_to(value).
are.equal_to()
tbl.where(column, are.equal_to(value))
Filter leaves rows only where the value in column is equal to value.
[166]:
trips.where("Duration", are.equal_to(519))
[166]:
| Trip ID | Duration | Start Date | Start Station | Start Terminal | End Date | End Station | End Terminal | Bike # | Subscriber Type | Zip Code |
|---|---|---|---|---|---|---|---|---|---|---|
| 723352 | 519 | 4/13/2015 17:04 | Howard at 2nd | 63 | 4/13/2015 17:12 | San Francisco Caltrain (Townsend at 4th) | 70 | 629 | Subscriber | 94061 |
| 824979 | 519 | 6/27/2015 15:02 | Japantown | 9 | 6/27/2015 15:11 | San Jose City Hall | 10 | 660 | Customer | nil |
| 439946 | 519 | 9/5/2014 12:38 | Yerba Buena Center of the Arts (3rd @ Howard) | 68 | 9/5/2014 12:47 | Civic Center BART (7th at Market) | 72 | 452 | Subscriber | 94105 |
| 788261 | 519 | 6/1/2015 9:21 | Powell at Post (Union Square) | 71 | 6/1/2015 9:30 | Steuart at Market | 74 | 575 | Subscriber | 94108 |
| 560479 | 519 | 11/28/2014 14:20 | South Van Ness at Market | 66 | 11/28/2014 14:29 | Powell at Post (Union Square) | 71 | 609 | Subscriber | 94108 |
| 653797 | 519 | 2/23/2015 8:47 | Market at 10th | 67 | 2/23/2015 8:55 | Yerba Buena Center of the Arts (3rd @ Howard) | 68 | 546 | Subscriber | 94102 |
| 887134 | 519 | 8/12/2015 17:29 | Civic Center BART (7th at Market) | 72 | 8/12/2015 17:38 | Mechanics Plaza (Market at Battery) | 75 | 313 | Subscriber | 94103 |
| 482225 | 519 | 10/3/2014 16:41 | Spear at Folsom | 49 | 10/3/2014 16:50 | Broadway St at Battery St | 82 | 209 | Subscriber | 94133 |
| 681697 | 519 | 3/14/2015 10:19 | Embarcadero at Sansome | 60 | 3/14/2015 10:28 | Harry Bridges Plaza (Ferry Building) | 50 | 368 | Customer | 95120 |
| 912821 | 519 | 8/31/2015 17:00 | Embarcadero at Folsom | 51 | 8/31/2015 17:09 | San Francisco Caltrain (Townsend at 4th) | 70 | 354 | Subscriber | 94085 |
... (115 rows omitted)
are.above()
tbl.where(column, are.above(value))
Filter leaves rows only where the value in column is strictly greater than value.
[167]:
trips.where("Duration", are.above(1000))
[167]:
| Trip ID | Duration | Start Date | Start Station | Start Terminal | End Date | End Station | End Terminal | Bike # | Subscriber Type | Zip Code |
|---|---|---|---|---|---|---|---|---|---|---|
| 710070 | 11460 | 4/2/2015 18:13 | Powell Street BART | 39 | 4/2/2015 21:24 | Powell Street BART | 39 | 375 | Subscriber | 94107 |
| 589964 | 15097 | 1/3/2015 15:22 | Embarcadero at Sansome | 60 | 1/3/2015 19:33 | Golden Gate at Polk | 59 | 599 | Customer | 29225 |
| 831509 | 1057 | 7/2/2015 10:14 | 2nd at Folsom | 62 | 7/2/2015 10:31 | South Van Ness at Market | 66 | 631 | Subscriber | 94114 |
| 442750 | 6084 | 9/8/2014 13:32 | Embarcadero at Sansome | 60 | 9/8/2014 15:14 | Embarcadero at Sansome | 60 | 368 | Customer | 474454 |
| 608714 | 19799 | 1/18/2015 10:07 | University and Emerson | 35 | 1/18/2015 15:37 | San Francisco Caltrain (Townsend at 4th) | 70 | 686 | Customer | nil |
| 711961 | 1026 | 4/4/2015 7:07 | Davis at Jackson | 42 | 4/4/2015 7:24 | Harry Bridges Plaza (Ferry Building) | 50 | 189 | Subscriber | 94111 |
| 833071 | 2314 | 7/4/2015 11:13 | Market at 4th | 76 | 7/4/2015 11:52 | Washington at Kearny | 46 | 602 | Customer | 94806 |
| 570731 | 1218 | 12/8/2014 23:51 | MLK Library | 11 | 12/9/2014 0:12 | St James Park | 13 | 299 | Customer | 95033 |
| 853698 | 1048 | 7/20/2015 10:53 | Broadway St at Battery St | 82 | 7/20/2015 11:10 | Embarcadero at Sansome | 60 | 636 | Customer | 91436 |
| 787510 | 3670 | 5/31/2015 10:47 | Mountain View City Hall | 27 | 5/31/2015 11:48 | Castro Street and El Camino Real | 32 | 713 | Customer | 94041 |
... (11576 rows omitted)
are.above_or_equal_to()
tbl.where(column, are.above_or_equal_to(value))
Filter leaves rows only where the value in column is greater than or equal to value.
[168]:
trips.where("Duration", are.above_or_equal_to(1000))
[168]:
| Trip ID | Duration | Start Date | Start Station | Start Terminal | End Date | End Station | End Terminal | Bike # | Subscriber Type | Zip Code |
|---|---|---|---|---|---|---|---|---|---|---|
| 710070 | 11460 | 4/2/2015 18:13 | Powell Street BART | 39 | 4/2/2015 21:24 | Powell Street BART | 39 | 375 | Subscriber | 94107 |
| 589964 | 15097 | 1/3/2015 15:22 | Embarcadero at Sansome | 60 | 1/3/2015 19:33 | Golden Gate at Polk | 59 | 599 | Customer | 29225 |
| 831509 | 1057 | 7/2/2015 10:14 | 2nd at Folsom | 62 | 7/2/2015 10:31 | South Van Ness at Market | 66 | 631 | Subscriber | 94114 |
| 442750 | 6084 | 9/8/2014 13:32 | Embarcadero at Sansome | 60 | 9/8/2014 15:14 | Embarcadero at Sansome | 60 | 368 | Customer | 474454 |
| 608714 | 19799 | 1/18/2015 10:07 | University and Emerson | 35 | 1/18/2015 15:37 | San Francisco Caltrain (Townsend at 4th) | 70 | 686 | Customer | nil |
| 711961 | 1026 | 4/4/2015 7:07 | Davis at Jackson | 42 | 4/4/2015 7:24 | Harry Bridges Plaza (Ferry Building) | 50 | 189 | Subscriber | 94111 |
| 833071 | 2314 | 7/4/2015 11:13 | Market at 4th | 76 | 7/4/2015 11:52 | Washington at Kearny | 46 | 602 | Customer | 94806 |
| 570731 | 1218 | 12/8/2014 23:51 | MLK Library | 11 | 12/9/2014 0:12 | St James Park | 13 | 299 | Customer | 95033 |
| 853698 | 1048 | 7/20/2015 10:53 | Broadway St at Battery St | 82 | 7/20/2015 11:10 | Embarcadero at Sansome | 60 | 636 | Customer | 91436 |
| 787510 | 3670 | 5/31/2015 10:47 | Mountain View City Hall | 27 | 5/31/2015 11:48 | Castro Street and El Camino Real | 32 | 713 | Customer | 94041 |
... (11597 rows omitted)
are.below()
tbl.where(column, are.below(value))
Filter leaves rows only where the value in column is strictly less than value.
[170]:
trips.where("Duration", are.below(100))
[170]:
| Trip ID | Duration | Start Date | Start Station | Start Terminal | End Date | End Station | End Terminal | Bike # | Subscriber Type | Zip Code |
|---|---|---|---|---|---|---|---|---|---|---|
| 482797 | 65 | 10/4/2014 7:50 | San Francisco Caltrain (Townsend at 4th) | 70 | 10/4/2014 7:52 | San Francisco Caltrain (Townsend at 4th) | 70 | 430 | Subscriber | 95112 |
| 483052 | 81 | 10/4/2014 13:52 | Harry Bridges Plaza (Ferry Building) | 50 | 10/4/2014 13:53 | Harry Bridges Plaza (Ferry Building) | 50 | 306 | Customer | nan |
| 569620 | 84 | 12/8/2014 10:09 | Civic Center BART (7th at Market) | 72 | 12/8/2014 10:10 | Civic Center BART (7th at Market) | 72 | 326 | Subscriber | 94111 |
| 502332 | 79 | 10/16/2014 17:26 | Beale at Market | 56 | 10/16/2014 17:27 | Temporary Transbay Terminal (Howard at Beale) | 55 | 613 | Subscriber | 94602 |
| 604012 | 76 | 1/14/2015 15:18 | Davis at Jackson | 42 | 1/14/2015 15:19 | Broadway St at Battery St | 82 | 601 | Subscriber | 94107 |
| 704918 | 70 | 3/30/2015 22:51 | Broadway St at Battery St | 82 | 3/30/2015 22:52 | Broadway St at Battery St | 82 | 394 | Subscriber | 94107 |
| 513458 | 83 | 10/24/2014 8:50 | 2nd at Folsom | 62 | 10/24/2014 8:51 | Howard at 2nd | 63 | 569 | Subscriber | 94107 |
| 696725 | 94 | 3/25/2015 8:47 | Post at Kearny | 47 | 3/25/2015 8:49 | Washington at Kearny | 46 | 516 | Subscriber | 94109 |
| 829817 | 86 | 7/1/2015 9:27 | Market at Sansome | 77 | 7/1/2015 9:28 | 2nd at South Park | 64 | 292 | Subscriber | 94538 |
| 745895 | 73 | 4/29/2015 13:05 | Yerba Buena Center of the Arts (3rd @ Howard) | 68 | 4/29/2015 13:06 | Yerba Buena Center of the Arts (3rd @ Howard) | 68 | 380 | Subscriber | 94947 |
... (403 rows omitted)
are.below_or_equal_to()
tbl.where(column, are.below_or_equal_to(value))
Filter leaves rows only where the value in column is less than or equal to value.
[171]:
trips.where("Duration", are.below_or_equal_to(100))
[171]:
| Trip ID | Duration | Start Date | Start Station | Start Terminal | End Date | End Station | End Terminal | Bike # | Subscriber Type | Zip Code |
|---|---|---|---|---|---|---|---|---|---|---|
| 482797 | 65 | 10/4/2014 7:50 | San Francisco Caltrain (Townsend at 4th) | 70 | 10/4/2014 7:52 | San Francisco Caltrain (Townsend at 4th) | 70 | 430 | Subscriber | 95112 |
| 483052 | 81 | 10/4/2014 13:52 | Harry Bridges Plaza (Ferry Building) | 50 | 10/4/2014 13:53 | Harry Bridges Plaza (Ferry Building) | 50 | 306 | Customer | nan |
| 569620 | 84 | 12/8/2014 10:09 | Civic Center BART (7th at Market) | 72 | 12/8/2014 10:10 | Civic Center BART (7th at Market) | 72 | 326 | Subscriber | 94111 |
| 502332 | 79 | 10/16/2014 17:26 | Beale at Market | 56 | 10/16/2014 17:27 | Temporary Transbay Terminal (Howard at Beale) | 55 | 613 | Subscriber | 94602 |
| 604012 | 76 | 1/14/2015 15:18 | Davis at Jackson | 42 | 1/14/2015 15:19 | Broadway St at Battery St | 82 | 601 | Subscriber | 94107 |
| 704918 | 70 | 3/30/2015 22:51 | Broadway St at Battery St | 82 | 3/30/2015 22:52 | Broadway St at Battery St | 82 | 394 | Subscriber | 94107 |
| 513458 | 83 | 10/24/2014 8:50 | 2nd at Folsom | 62 | 10/24/2014 8:51 | Howard at 2nd | 63 | 569 | Subscriber | 94107 |
| 696725 | 94 | 3/25/2015 8:47 | Post at Kearny | 47 | 3/25/2015 8:49 | Washington at Kearny | 46 | 516 | Subscriber | 94109 |
| 808199 | 100 | 6/15/2015 20:57 | Post at Kearny | 47 | 6/15/2015 20:58 | 2nd at South Park | 64 | 537 | Subscriber | 94107 |
| 829817 | 86 | 7/1/2015 9:27 | Market at Sansome | 77 | 7/1/2015 9:28 | 2nd at South Park | 64 | 292 | Subscriber | 94538 |
... (430 rows omitted)
are.between()
tbl.where(column, are.between(x, y))
Filter leaves rows only where the value in column is greather than or equal to x and less than y (i.e. in the interval \([x, y)\)).
[172]:
trips.where("Duration", are.between(100, 200))
[172]:
| Trip ID | Duration | Start Date | Start Station | Start Terminal | End Date | End Station | End Terminal | Bike # | Subscriber Type | Zip Code |
|---|---|---|---|---|---|---|---|---|---|---|
| 437830 | 151 | 9/4/2014 9:13 | Grant Avenue at Columbus Avenue | 73 | 9/4/2014 9:15 | Commercial at Montgomery | 45 | 306 | Subscriber | 94104 |
| 436255 | 195 | 9/3/2014 11:53 | 2nd at Folsom | 62 | 9/3/2014 11:57 | Spear at Folsom | 49 | 403 | Subscriber | 94107 |
| 585884 | 151 | 12/26/2014 13:34 | Broadway St at Battery St | 82 | 12/26/2014 13:37 | Harry Bridges Plaza (Ferry Building) | 50 | 576 | Subscriber | 94107 |
| 548322 | 191 | 11/17/2014 20:10 | Yerba Buena Center of the Arts (3rd @ Howard) | 68 | 11/17/2014 20:13 | Market at Sansome | 77 | 29 | Subscriber | 94705 |
| 594999 | 185 | 1/7/2015 17:53 | San Antonio Caltrain Station | 29 | 1/7/2015 17:56 | San Antonio Shopping Center | 31 | 176 | Subscriber | 94040 |
| 468534 | 194 | 9/24/2014 19:08 | Mechanics Plaza (Market at Battery) | 75 | 9/24/2014 19:11 | Harry Bridges Plaza (Ferry Building) | 50 | 443 | Subscriber | 94107 |
| 873710 | 169 | 8/3/2015 17:20 | Broadway St at Battery St | 82 | 8/3/2015 17:23 | Embarcadero at Sansome | 60 | 532 | Subscriber | 94114 |
| 853087 | 168 | 7/20/2015 7:27 | Temporary Transbay Terminal (Howard at Beale) | 55 | 7/20/2015 7:30 | 2nd at Folsom | 62 | 418 | Subscriber | 94602 |
| 863019 | 162 | 7/27/2015 8:31 | Temporary Transbay Terminal (Howard at Beale) | 55 | 7/27/2015 8:34 | Mechanics Plaza (Market at Battery) | 75 | 504 | Subscriber | 94111 |
| 883134 | 173 | 8/10/2015 15:11 | Embarcadero at Folsom | 51 | 8/10/2015 15:14 | Beale at Market | 56 | 363 | Subscriber | 94117 |
... (5083 rows omitted)
are.between_or_equal_to()
tbl.where(column, are.between_or_equal_to(x, y))
Filter leaves rows only where the value in column is between or equal to x and y (i.e. in the interval \([x, y]\)).
[173]:
trips.where("Duration", are.between_or_equal_to(100, 200))
[173]:
| Trip ID | Duration | Start Date | Start Station | Start Terminal | End Date | End Station | End Terminal | Bike # | Subscriber Type | Zip Code |
|---|---|---|---|---|---|---|---|---|---|---|
| 437830 | 151 | 9/4/2014 9:13 | Grant Avenue at Columbus Avenue | 73 | 9/4/2014 9:15 | Commercial at Montgomery | 45 | 306 | Subscriber | 94104 |
| 436255 | 195 | 9/3/2014 11:53 | 2nd at Folsom | 62 | 9/3/2014 11:57 | Spear at Folsom | 49 | 403 | Subscriber | 94107 |
| 585884 | 151 | 12/26/2014 13:34 | Broadway St at Battery St | 82 | 12/26/2014 13:37 | Harry Bridges Plaza (Ferry Building) | 50 | 576 | Subscriber | 94107 |
| 548322 | 191 | 11/17/2014 20:10 | Yerba Buena Center of the Arts (3rd @ Howard) | 68 | 11/17/2014 20:13 | Market at Sansome | 77 | 29 | Subscriber | 94705 |
| 903735 | 200 | 8/25/2015 7:59 | Temporary Transbay Terminal (Howard at Beale) | 55 | 8/25/2015 8:02 | Steuart at Market | 74 | 453 | Subscriber | 94501 |
| 594999 | 185 | 1/7/2015 17:53 | San Antonio Caltrain Station | 29 | 1/7/2015 17:56 | San Antonio Shopping Center | 31 | 176 | Subscriber | 94040 |
| 468534 | 194 | 9/24/2014 19:08 | Mechanics Plaza (Market at Battery) | 75 | 9/24/2014 19:11 | Harry Bridges Plaza (Ferry Building) | 50 | 443 | Subscriber | 94107 |
| 873710 | 169 | 8/3/2015 17:20 | Broadway St at Battery St | 82 | 8/3/2015 17:23 | Embarcadero at Sansome | 60 | 532 | Subscriber | 94114 |
| 853087 | 168 | 7/20/2015 7:27 | Temporary Transbay Terminal (Howard at Beale) | 55 | 7/20/2015 7:30 | 2nd at Folsom | 62 | 418 | Subscriber | 94602 |
| 863019 | 162 | 7/27/2015 8:31 | Temporary Transbay Terminal (Howard at Beale) | 55 | 7/27/2015 8:34 | Mechanics Plaza (Market at Battery) | 75 | 504 | Subscriber | 94111 |
... (5180 rows omitted)
are.contained_in()
tbl.where(column, are.contained_in(string_or_array))
Filter leaves rows only where the value in column is a substring of string_or_array if it is a string or an element of string_or_array if it is an array
[176]:
trips.where("Start Station", are.contained_in("2nd at Folsom San Antonio Caltrain Station"))
[176]:
| Trip ID | Duration | Start Date | Start Station | Start Terminal | End Date | End Station | End Terminal | Bike # | Subscriber Type | Zip Code |
|---|---|---|---|---|---|---|---|---|---|---|
| 436255 | 195 | 9/3/2014 11:53 | 2nd at Folsom | 62 | 9/3/2014 11:57 | Spear at Folsom | 49 | 403 | Subscriber | 94107 |
| 831509 | 1057 | 7/2/2015 10:14 | 2nd at Folsom | 62 | 7/2/2015 10:31 | South Van Ness at Market | 66 | 631 | Subscriber | 94114 |
| 877160 | 306 | 8/5/2015 16:33 | 2nd at Folsom | 62 | 8/5/2015 16:39 | Beale at Market | 56 | 527 | Subscriber | 94602 |
| 768619 | 840 | 5/15/2015 11:35 | 2nd at Folsom | 62 | 5/15/2015 11:49 | Market at 10th | 67 | 604 | Subscriber | 94903 |
| 594999 | 185 | 1/7/2015 17:53 | San Antonio Caltrain Station | 29 | 1/7/2015 17:56 | San Antonio Shopping Center | 31 | 176 | Subscriber | 94040 |
| 701211 | 252 | 3/27/2015 16:26 | 2nd at Folsom | 62 | 3/27/2015 16:30 | Spear at Folsom | 49 | 405 | Subscriber | 94105 |
| 487432 | 561 | 10/7/2014 17:48 | 2nd at Folsom | 62 | 10/7/2014 17:58 | Commercial at Montgomery | 45 | 342 | Subscriber | 94107 |
| 610970 | 808 | 1/20/2015 13:28 | 2nd at Folsom | 62 | 1/20/2015 13:42 | Harry Bridges Plaza (Ferry Building) | 50 | 310 | Subscriber | 94025 |
| 753668 | 196 | 5/5/2015 11:48 | 2nd at Folsom | 62 | 5/5/2015 11:52 | Temporary Transbay Terminal (Howard at Beale) | 55 | 533 | Subscriber | 94973 |
| 466551 | 222 | 9/23/2014 18:12 | 2nd at Folsom | 62 | 9/23/2014 18:16 | 2nd at Townsend | 61 | 620 | Subscriber | 94107 |
... (2578 rows omitted)
[178]:
trips.where("Start Terminal", are.contained_in(make_array(62, 29)))
[178]:
| Trip ID | Duration | Start Date | Start Station | Start Terminal | End Date | End Station | End Terminal | Bike # | Subscriber Type | Zip Code |
|---|---|---|---|---|---|---|---|---|---|---|
| 436255 | 195 | 9/3/2014 11:53 | 2nd at Folsom | 62 | 9/3/2014 11:57 | Spear at Folsom | 49 | 403 | Subscriber | 94107 |
| 831509 | 1057 | 7/2/2015 10:14 | 2nd at Folsom | 62 | 7/2/2015 10:31 | South Van Ness at Market | 66 | 631 | Subscriber | 94114 |
| 877160 | 306 | 8/5/2015 16:33 | 2nd at Folsom | 62 | 8/5/2015 16:39 | Beale at Market | 56 | 527 | Subscriber | 94602 |
| 768619 | 840 | 5/15/2015 11:35 | 2nd at Folsom | 62 | 5/15/2015 11:49 | Market at 10th | 67 | 604 | Subscriber | 94903 |
| 594999 | 185 | 1/7/2015 17:53 | San Antonio Caltrain Station | 29 | 1/7/2015 17:56 | San Antonio Shopping Center | 31 | 176 | Subscriber | 94040 |
| 701211 | 252 | 3/27/2015 16:26 | 2nd at Folsom | 62 | 3/27/2015 16:30 | Spear at Folsom | 49 | 405 | Subscriber | 94105 |
| 487432 | 561 | 10/7/2014 17:48 | 2nd at Folsom | 62 | 10/7/2014 17:58 | Commercial at Montgomery | 45 | 342 | Subscriber | 94107 |
| 610970 | 808 | 1/20/2015 13:28 | 2nd at Folsom | 62 | 1/20/2015 13:42 | Harry Bridges Plaza (Ferry Building) | 50 | 310 | Subscriber | 94025 |
| 753668 | 196 | 5/5/2015 11:48 | 2nd at Folsom | 62 | 5/5/2015 11:52 | Temporary Transbay Terminal (Howard at Beale) | 55 | 533 | Subscriber | 94973 |
| 466551 | 222 | 9/23/2014 18:12 | 2nd at Folsom | 62 | 9/23/2014 18:16 | 2nd at Townsend | 61 | 620 | Subscriber | 94107 |
... (2578 rows omitted)
are.containing()
tbl.where(column, are.containing(value))
Filter leaves rows only where the value in column contains the substring value.
[180]:
trips.where("End Station", are.containing("at"))
[180]:
| Trip ID | Duration | Start Date | Start Station | Start Terminal | End Date | End Station | End Terminal | Bike # | Subscriber Type | Zip Code |
|---|---|---|---|---|---|---|---|---|---|---|
| 876419 | 413 | 8/5/2015 8:29 | Civic Center BART (7th at Market) | 72 | 8/5/2015 8:36 | Townsend at 7th | 65 | 269 | Subscriber | 94518 |
| 459672 | 408 | 9/18/2014 17:11 | Harry Bridges Plaza (Ferry Building) | 50 | 9/18/2014 17:17 | Embarcadero at Sansome | 60 | 429 | Subscriber | 94111 |
| 903647 | 723 | 8/25/2015 7:26 | San Francisco Caltrain 2 (330 Townsend) | 69 | 8/25/2015 7:38 | Market at 10th | 67 | 631 | Subscriber | 94025 |
| 452829 | 409 | 9/15/2014 8:29 | Steuart at Market | 74 | 9/15/2014 8:36 | Market at 4th | 76 | 428 | Subscriber | 94925 |
| 491023 | 224 | 10/9/2014 16:13 | Santa Clara at Almaden | 4 | 10/9/2014 16:17 | San Jose Diridon Caltrain Station | 2 | 144 | Subscriber | 94117 |
| 723352 | 519 | 4/13/2015 17:04 | Howard at 2nd | 63 | 4/13/2015 17:12 | San Francisco Caltrain (Townsend at 4th) | 70 | 629 | Subscriber | 94061 |
| 524499 | 431 | 10/31/2014 16:36 | Townsend at 7th | 65 | 10/31/2014 16:43 | Civic Center BART (7th at Market) | 72 | 630 | Subscriber | 94706 |
| 518524 | 389 | 10/28/2014 8:48 | Market at Sansome | 77 | 10/28/2014 8:54 | 2nd at South Park | 64 | 458 | Subscriber | 94610 |
| 793149 | 616 | 6/4/2015 5:26 | Embarcadero at Bryant | 54 | 6/4/2015 5:36 | Embarcadero at Sansome | 60 | 289 | Subscriber | 94105 |
| 681771 | 895 | 3/14/2015 11:46 | Market at 10th | 67 | 3/14/2015 12:01 | Market at 4th | 76 | 416 | Subscriber | 94107 |
... (78805 rows omitted)
are.strictly_between()
tbl.where(column, are.strictly_between(x, y))
Filter leaves rows only where the value in column is strictly greater than x and less than y (i.e. in the interval \((x, y)\)).
[181]:
trips.where("Duration", are.strictly_between(100, 200))
[181]:
| Trip ID | Duration | Start Date | Start Station | Start Terminal | End Date | End Station | End Terminal | Bike # | Subscriber Type | Zip Code |
|---|---|---|---|---|---|---|---|---|---|---|
| 437830 | 151 | 9/4/2014 9:13 | Grant Avenue at Columbus Avenue | 73 | 9/4/2014 9:15 | Commercial at Montgomery | 45 | 306 | Subscriber | 94104 |
| 436255 | 195 | 9/3/2014 11:53 | 2nd at Folsom | 62 | 9/3/2014 11:57 | Spear at Folsom | 49 | 403 | Subscriber | 94107 |
| 585884 | 151 | 12/26/2014 13:34 | Broadway St at Battery St | 82 | 12/26/2014 13:37 | Harry Bridges Plaza (Ferry Building) | 50 | 576 | Subscriber | 94107 |
| 548322 | 191 | 11/17/2014 20:10 | Yerba Buena Center of the Arts (3rd @ Howard) | 68 | 11/17/2014 20:13 | Market at Sansome | 77 | 29 | Subscriber | 94705 |
| 594999 | 185 | 1/7/2015 17:53 | San Antonio Caltrain Station | 29 | 1/7/2015 17:56 | San Antonio Shopping Center | 31 | 176 | Subscriber | 94040 |
| 468534 | 194 | 9/24/2014 19:08 | Mechanics Plaza (Market at Battery) | 75 | 9/24/2014 19:11 | Harry Bridges Plaza (Ferry Building) | 50 | 443 | Subscriber | 94107 |
| 873710 | 169 | 8/3/2015 17:20 | Broadway St at Battery St | 82 | 8/3/2015 17:23 | Embarcadero at Sansome | 60 | 532 | Subscriber | 94114 |
| 853087 | 168 | 7/20/2015 7:27 | Temporary Transbay Terminal (Howard at Beale) | 55 | 7/20/2015 7:30 | 2nd at Folsom | 62 | 418 | Subscriber | 94602 |
| 863019 | 162 | 7/27/2015 8:31 | Temporary Transbay Terminal (Howard at Beale) | 55 | 7/27/2015 8:34 | Mechanics Plaza (Market at Battery) | 75 | 504 | Subscriber | 94111 |
| 883134 | 173 | 8/10/2015 15:11 | Embarcadero at Folsom | 51 | 8/10/2015 15:14 | Beale at Market | 56 | 363 | Subscriber | 94117 |
... (5056 rows omitted)
Miscellaneous Functions
sample_proportions()
sample_proportions(sample_size, model_proportions)
Samples sample_size objects from the distribution specified by model_proportions. sample_size should be an integer, model_proportions an array of probabilities that sum up to 1. It returns an array with the same size as model_proportions. Each item in the array corresponds to the proportion of times it was sampled out of the sample_size times.
[182]:
sample_proportions(100, [.5, .3, .2])
[182]:
array([0.32, 0.32, 0.36])
minimize()
minimize(function)
This function returns an array of values that minimize function. function should be a function that takes in a certain number of arguments and returns a number. The array returned by minimize is structured such that if each value in the array was passed into function as arguments, it would minimize the output value of function.
[190]:
def f(x, y):
    return 0.47 * x**2 + 1.23 * np.log(y)

minimize(f)
[190]:
array([ 5.17585792, -0.58835469])